To say the solar industry has grown in the last decade would be a serious understatement. Between 2010 and 2020, total solar energy production in the U.S. grew a remarkable 3,000 percent.
Increased awareness about the heavy toll burning fossil fuel takes on our environment has, no doubt, played a role. But, at the end of the day, it’s the bottom line that moves people.
As you can see in the graph below from a report by the Solar Energy Industries Association (SEIA), the explosive growth in solar energy has occurred against the backdrop of a steady and remarkable decrease in costs. (The rising bars represent increased solar capacity, while the falling line indicates the steep drop in prices.)
Since 2010, the cost of installing a solar system has gone down an astounding 78%. As a result, while switching to clean and renewable solar energy would have probably meant taking a financial hit in 2010, in 2021 it’s likely to mean significantly reduced energy expenses.
But not all solar costs have gone down equally.
HARD vs. SOFT COSTS
Hard costs refer to the price of the physical components of your solar system; the mounting racks, inverters, wiring, and, of course, the solar panels themselves.
Soft costs, on the other hand, include all of the rest. Labor, system design, permit fees, taxes, and anything else that isn’t a physical part of your solar system count as soft costs.
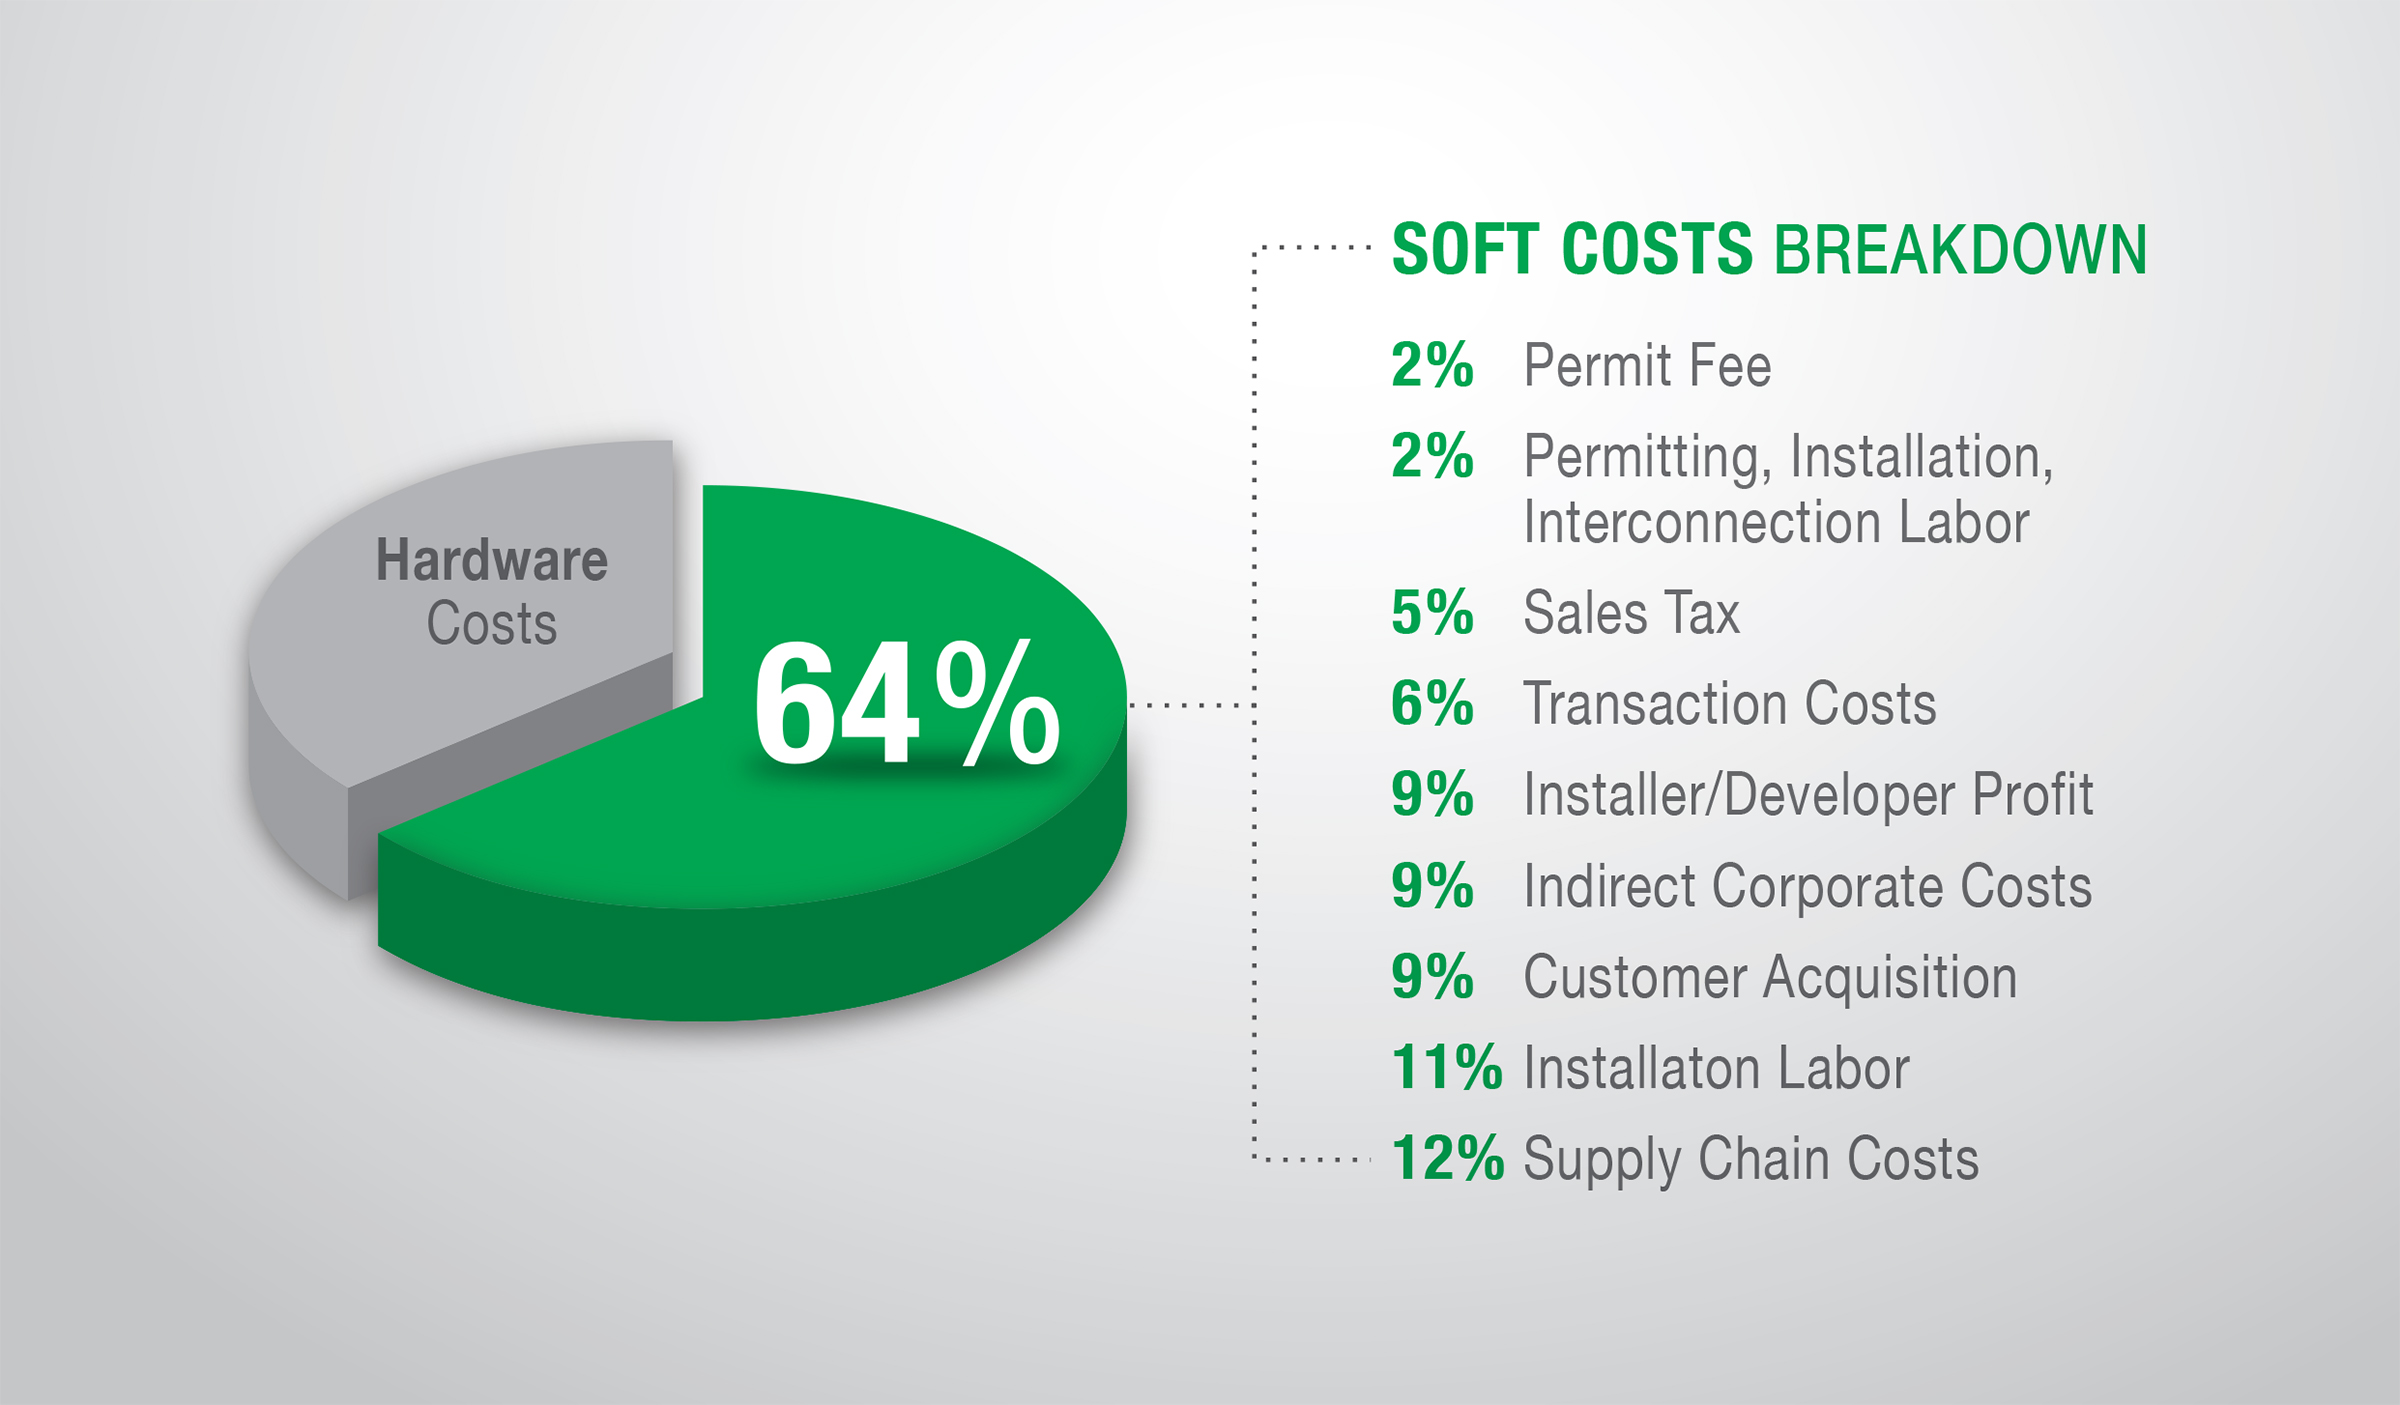
This graph sourced from the Department of Energy, gives a breakdown of average solar installation soft costs as a percentage of total costs.

As you can see, though each soft cost itself only makes up a small percentage, there are a lot of them, and they quickly start to add up to the point where they total over two-thirds of the overall cost of installing a solar system.
SOLAR PANEL COSTS
The remarkable decrease in the cost of solar installations over the past decade is entirely due to decreased hard costs. Moreover, the decrease in hard costs is itself almost entirely a result of a huge reduction in the cost of solar panels.
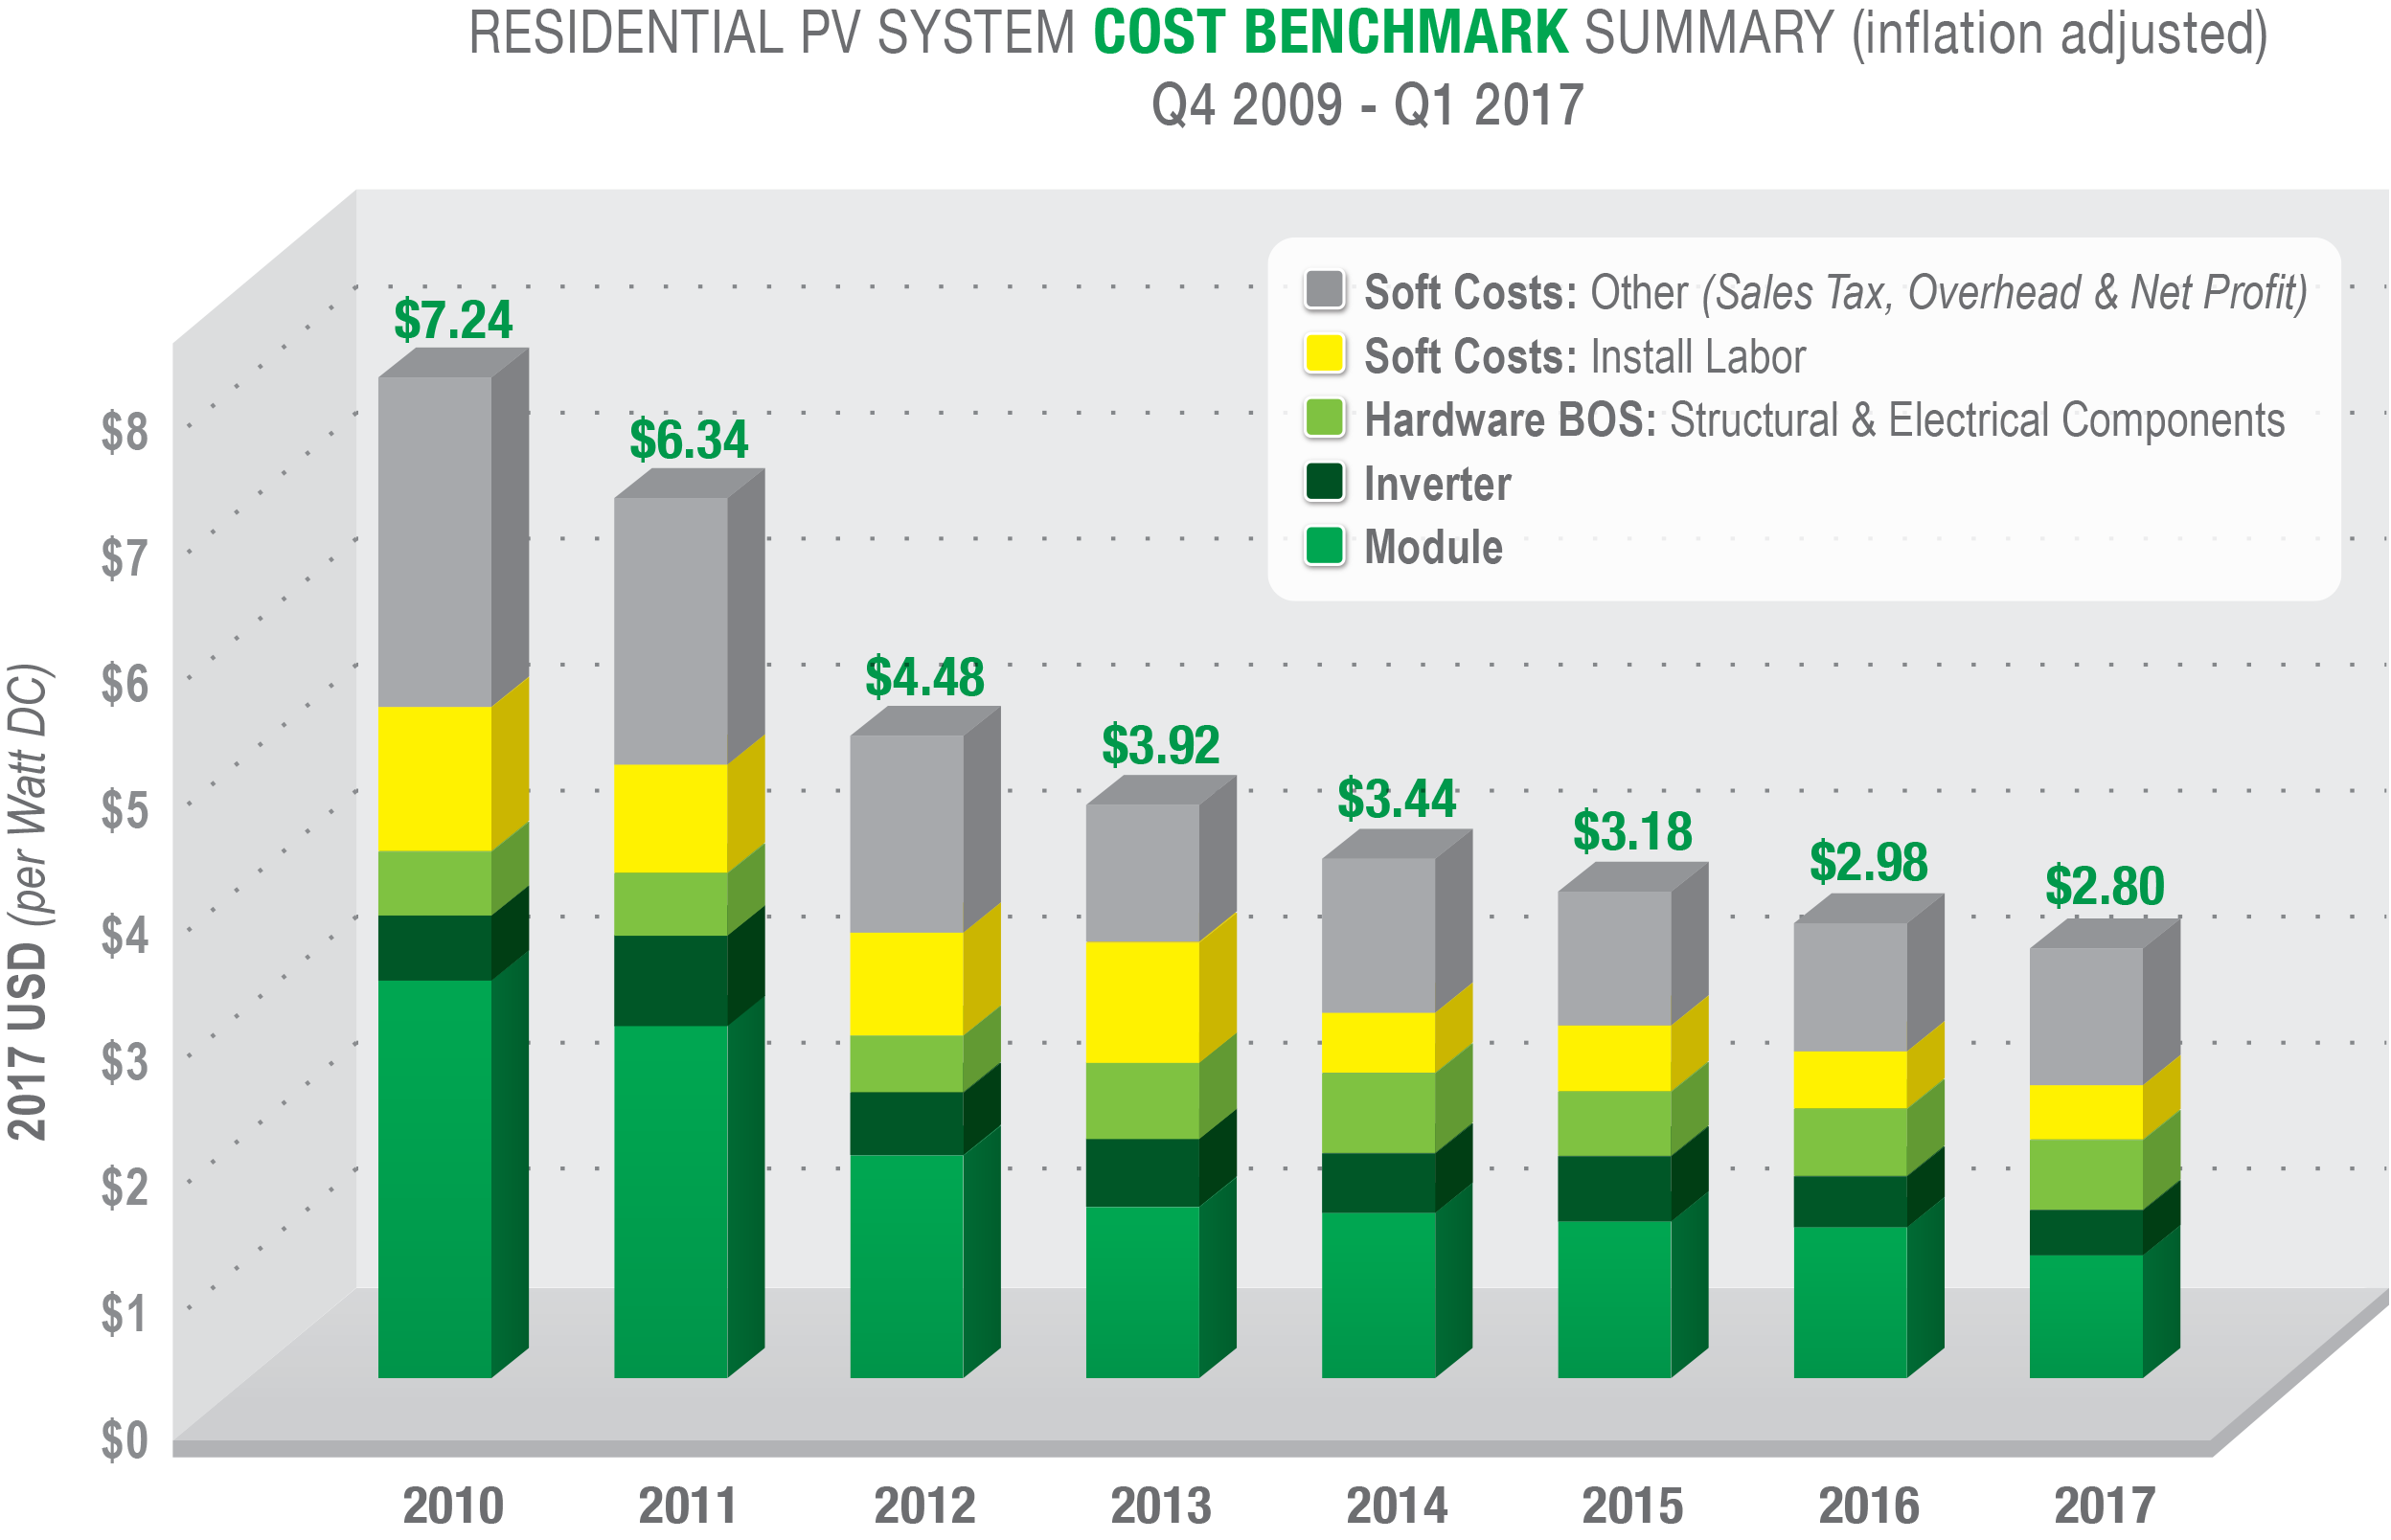
Here’s a graph from a 2017 SEIA report that breaks down changes in the cost of installing a solar system from 2010 on. Solar panels are represented by the bottom green portion.

As you can see, though every category decreased somewhat, most of the overall decrease was due to a steady drop in panel prices. In 2010, solar panels made up around a third of total system costs. But by 2017, they were down to around only a tenth.
Labor costs also fell somewhat significantly, as did the hard cost of inverters, though neither fell nearly as much as the cost of solar panels.
PROSPECTS FOR FURTHER REDUCTIONS
Hardware costs have been reduced to a small enough percentage that future decreases in panel or inverter prices are unlikely to yield significant decreases in overall costs.
And the remaining soft costs that now make up the bulk are, to some extent, simply part of doing business. Employees and business expenses have to be paid, new customers have to be acquired, and the business has to make a profit in order to keep its doors open.
It remains to be seen whether the extraordinary decrease in the cost of solar installations has bottomed out. But, as the first SEIA graph indicates, the reduction in cost since 2010 has been flattening out since 2015.
So, any future cost reductions may not be nearly as huge as those the solar industry has witnessed in the last decade.